Testing of Volt-Ampere Characteristics of Circuit Components
4. Measure the volt-ampere characteristics of the Zener diode
(1) Replace the diode in Figure 3-3 with a Zener diode (2CW51), repeat the measurement data of Experiment Content 3, and record them in Table 3-5.
(2) Reverse characteristic experiment: Replace the 200Ω resistor in Figure 3-3 with 1K, connect 2CW51 in reverse, measure the reverse characteristics of 2CW51, and the output voltage of the regulated power supply ranges from 0-20V,
V. Experimental Precautions
1. When measuring the forward characteristics of the diode, the output of the regulated power supply should be gradually increased from small to large, and always pay attention to the ammeter reading not exceeding 25mA. Do not short-circuit the output terminals of the regulated source.
2. When conducting the above experiments, first estimate the voltage and current values, reasonably select the range of the instruments, and pay attention to the polarity of the instruments.
3. If measuring the volt-ampere characteristics of 2AP9, the voltage values for the forward characteristics should be taken as
0,0.1,0.13,0.15,0.17,0.19,0.21,0.24,0.30(V), and the voltage for the reverse characteristics should be taken as 0,2,4,6,8,10(V).
VI. Pre-study Thinking Questions
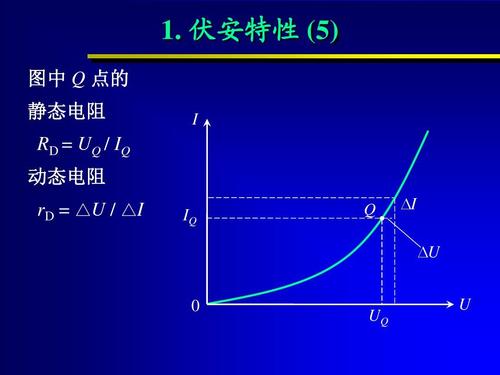
1. What are the concepts of linear resistance and nonlinear resistance? What is the difference between the volt-ampere characteristics of a resistor and a diode?
2. If the functional expression of the component's volt-ampere characteristic is I=f(U), how should the coordinate variables be placed when plotting the characteristic curve?
3. What is the difference between a Zener diode and an ordinary diode, and what are their uses?
VII. Experiment Report
1. Based on the experimental results and the data in the tables, plot the respective volt-ampere characteristic curves on graph paper (the forward and reverse characteristics of the diode and Zener diode are required to be drawn on the same graph, and the forward and reverse voltages can use different scales).
2. Provide appropriate explanations for the experimental results, and summarize and generalize the characteristics of each tested component.
3. Necessary error analysis.
4. Summarize the gains from this experiment.